This web page was produced as an assignment for Genetics 564, an undergraduate capstone course at UW-Madison.
How do we measure gene expression?
Beyond looking at the DNA within the genome, we also care about which genes are expressed in various cell types. All the RNA transcripts in a given cell are collectively referred to as the transcriptome [1]. Analyzing the transcriptome can be used to look at the RNA expression within a given cell time, or to look for which cell types a certain gene is expressed.
What can the transcriptome tell us about AIRE?
Many studies have been done to look at the how AIRE loss of function impacts the transcriptome of thymus cells. The purpose of these studies is to look at the difference between transcripts when AIRE is expressed vs lost to better understand what genes AIRE promotes the expression of.
GEO DataSets: GEO datasets are databases compiled from many original study samples to give a compiled version of all data with the same Platform, meaning the array elements are the same [2]. In this case, the genes in each room as the same across the samples in each column, where the samples represent wild type vs knockout samples in mice.
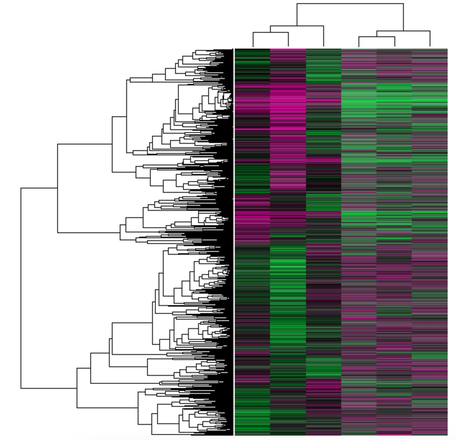
The image at the right comes from GEO datasets and shows the expression profile of AIRE knockout vs wild type thymic epithelial cells in mice. Each of the six columns represent different samples, and each row represents an individual gene. The data is displayed in the format of a heat map, where pink indicates higher expression and green indicates lower expression. The three left hand columns are controls, while the three right hand columns are AIRE knockouts [3]. The information contained in this figure can be used to study how expression level changes in AIRE knockout thymic epithelial cells compared to wild type.
The image at the right comes from GEO datasets and shows the expression profile of AIRE knockout vs wild type thymic epithelial cells in mice. Each of the six columns represent different samples, and each row represents an individual gene. The data is displayed in the format of a heat map, where pink indicates higher expression and green indicates lower expression. The three left hand columns are controls, while the three right hand columns are AIRE knockouts [3]. The information contained in this figure can be used to study how expression level changes in AIRE knockout thymic epithelial cells compared to wild type.
GEO Profiles: Geo profiles are derived from datasets and show the expression level of a specific gene in all of the dataset samples [4]. When "AIRE" is searched in GEO profiles, there are many results that give information about the specific expression pattern of a gene under a control vs experimental condition. For all of the results when AIRE was searched, click here. Some of the results show the different expression levels of AIRE under varying conditions, but the majority of results show how the expression of some other gene changed in control vs AIRE knockout cells or mice.
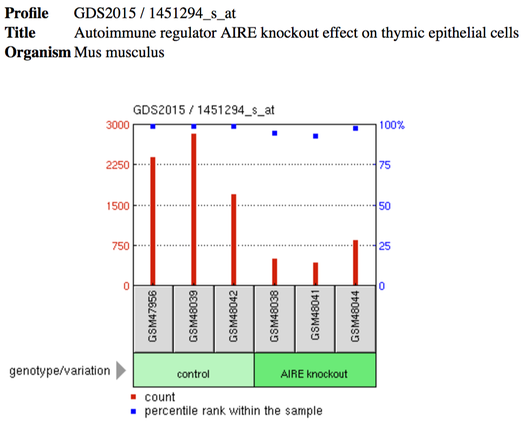
The example displayed on the right shows how the expression of Snrpe, also known as small nuclear ribonucleoprotein E, in control vs AIRE knockout mice. The profile is called "Snrpe - Autoimmune regulator AIRE knockout effect on thymic epithelial cells." The red bars indicates the expression of Snrpe in each sample (indicated by the grey box).
The example displayed on the right shows how the expression of Snrpe, also known as small nuclear ribonucleoprotein E, in control vs AIRE knockout mice. The profile is called "Snrpe - Autoimmune regulator AIRE knockout effect on thymic epithelial cells." The red bars indicates the expression of Snrpe in each sample (indicated by the grey box).
References:
[1] NIH. Transcriptome. https://www.genome.gov/13014330/
[2] GEO overview. https://www.ncbi.nlm.nih.gov/geo/info/overview.html
[3] DataSet Record GDS2015. Autoimmune regulator AIRE knockout effect on thymic epithelial cells. https://www.ncbi.nlm.nih.gov/sites/GDSbrowser
[4] About GEO profiles. https://www.ncbi.nlm.nih.gov/geo/info/profiles.html
