This web page was produced as an assignment for Genetics 564, an undergraduate capstone course at UW-Madison.
The field of phylogenetics studies the evolutionary relationship of different populations or species. The following phylogenetic analysis examines the relationship between AIRE protein homologs in multiple species.
Steps to constructing Phylogenetic Trees
The first step in making the tree is finding sequence data for the homologs. These are the FASTA formatted sequences (see links on Homology page). Then, multiple sequence alignment was performed on the FASTA sequences using Clustal Omega which compares the protein sequences and identifies conserved regions. The output from Clustal Omega can be visualized using Jalview:

The above image shows the Jalview output for AIRE multiple sequence alignment. Each column represents a unique amino acid position and the rows represent the different species' sequences. Columns are highlighted with the same color if there is conservation across the sequences being compared. The graphs below the colored sequence track the conservation, quality, and consensus. The conservation is based on the similarity of physio-chemical properties for the amino acid in each column [1]. The conservation score is listed below the conservation graph and indicates the level of conservation. Scores range from 0 to 11 (11 is marked by the *). Identical amino acids score the highest, and amino acids in the same group (with similar chemistry) score the next highest [1]. The consensus measure reflects the percent of a given residue seen at each position. The letter listed below is the most common amino acid at the given position.
Similarity scoring
BLOSUM62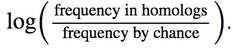
BLOSUM62 stands for BLOSUM stands for BLOck SUbstitution Matrix. Being a substitution matrix means it scores the probability that one amino acid will be substituted for another [2]. BLOSUM uses a log odds ratio based on the frequency of the observed alignment given evolutionary distance over the frequency of the alignment occurring by chance [3].
|
PID (percent identity)Percent identity (PID) refers to the percentage of columns that match between two sequences when aligned optimally (pairwise) [4]. Average percent identity can be calculated between two sequences or for entire families.
|
Tree building methods
Average distanceAverage distance trees are constructed using similarity scores to organize species based on similarity. The branch lengths are the same length, which assumes that the length of divergence from the most recent common ancestor is the same between two species (for example, human and chimpanzee have the same length branch from their most recent common ancestor).
|
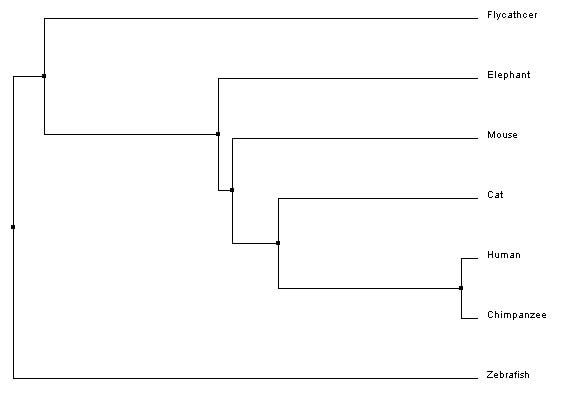
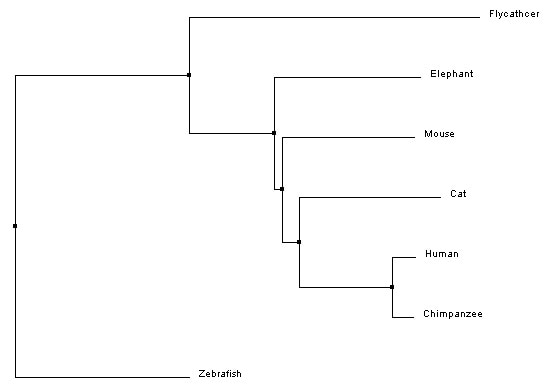
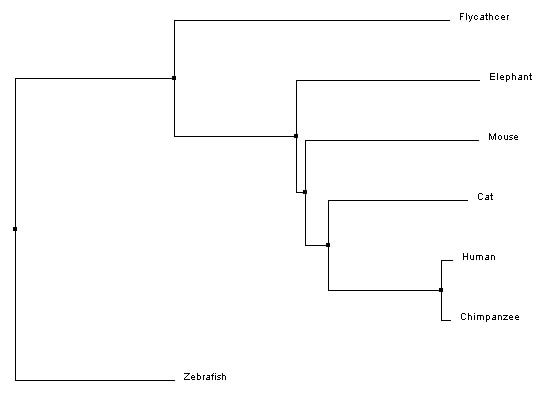
Neighbor joiningNeighbor joining, like average distance, uses the similarity scores to generate the tree. However, neighbor joining begins with all species connected to a central node and first creates a subgroup made of the two most similar groups. Then, the next closest group is added, and so on, until the whole tree is organized by relatedness [5]. The branches are different lengths to indicate evolutionary distance.
|

|
Average Distance Trees (BLOSUM62 and PID)
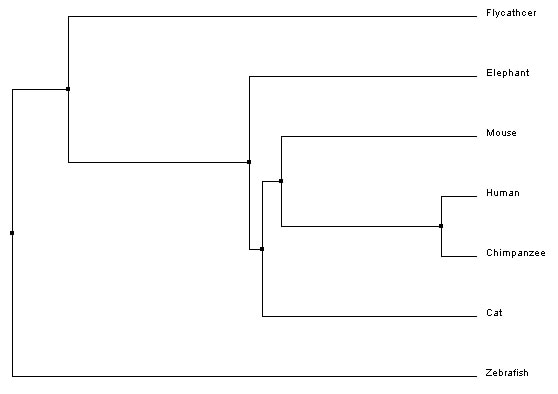
Average Distance tree using BLOSUM62
|
Average Distance tree using PID
|
Neighbor joining trees (BLOSUM62 and PID)
Neighbor Joining tree using BLOSUM62
|
Neighbor Joining tree using PID
|
References
[1] Jalview. http://www.jalview.org/tutorial/TheJalviewTutorial_screen.pdf
[2]Columbia University. BLOSUM Scoring Matrices. http://www.cs.columbia.edu/4761/assignments/assignment1/reference1
[3] Pearson, 2013. Selecting the Right Similarity-Scoring Matrix. https://www.ncbi.nlm.nih.gov/pmc/articles/PMC3848038/
[4] Ye et al. 2016. PnpProbs: a better multiple sequence alignment tool by better handling of guide trees. https://www.ncbi.nlm.nih.gov/pmc/articles/PMC5009527/
[5] Karthik Pasupathy R. Neighbor Joining Method. http://www.srmuniv.ac.in/sites/default/files/files/3(5).pdf
